 help: support@bizint.com
Resources
COVID-19 Vaccines - Dashboard
February 23, 2021
The COVID-19 pandemic has generated intense interest in efforts by the global pharmaceutical community to develop COVID-19 vaccines. The BizInt Smart Charts team has applied tools in the BizInt Smart Charts product family, including VantagePoint – Smart Charts Edition (VP-SCE), to create visualizations of the COVID-19 vaccine landscape.
COVID-19 Vaccine Dashboard


Pipeline Bullseye
[Visualization 1/4]
Our VP-SCE Bullseye is a compact way to show development progress of a number of projects divided into groups. This bullseye presents COVID-19 vaccines in clinical trials in the US, Europe and UK, grouped by vaccine technology. Vaccines are plotted by the highest phase in the US, UK or Europe.
Sources: Citeline Pharmaprojects, Adis R&D Insight, Cortellis
Bullseye
[Visualization 2/4]
Our VP-SCE Bullseye is a compact way to show development progress of a number of projects divided into groups. This bullseye presents COVID-19 vaccines which are not in clinical trials in the US, Europe and UK, grouped by vaccine technology. Vaccines are plotted by the highest phase.
Sources: Citeline Pharmaprojects, Adis R&D Insight, Cortellis
Trial Timeline
[Visualization 3/4]
This VP-SCE Timeline shows trials in progress for selected COVID-19 vaccines. We have labeled each vaccine with a commonly used name, and by the organizations leading the development.
For each vaccine project, we show the status and duration of key trials, as well as selected milestones from the press.
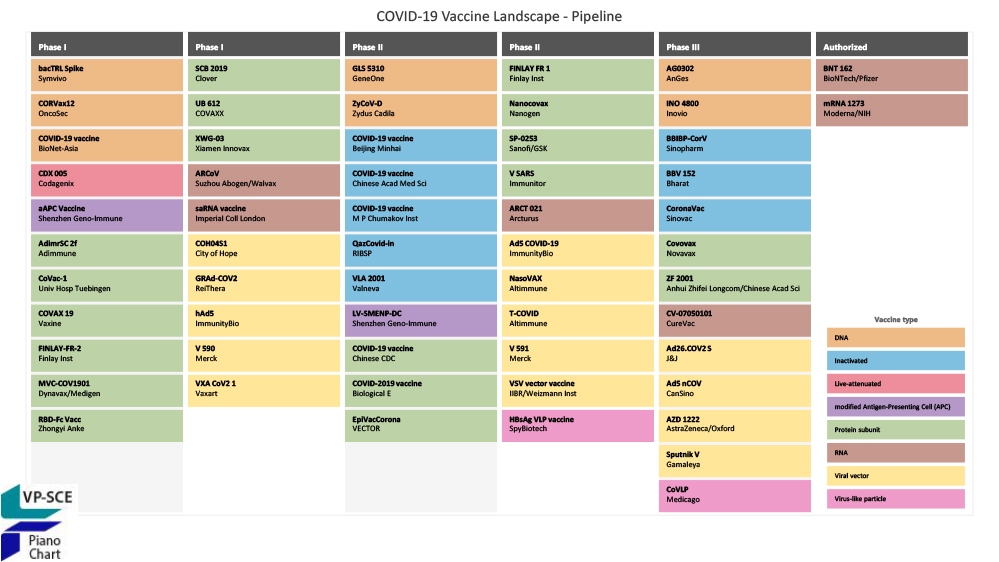
Piano Chart
[Visualization 4/4]
The VP-SCE Piano Chart is another way to display drugs by phase. This piano chart shows COVID-19 vaccines by phase, color coded by vaccine technology.
These visualizations were created from a variety of sources, as described on the pages for each visualization. The current bullseye is based on commercial drug pipeline databases from our parters: Citeline Pharmaprojects, Adis R&D Insight, and Clarivate Cortellis. Other visualizations, such as the timeline, are derived from data on ClinicalTrials.gov.


